Implementing, Monitoring, and Tuning for performance
SQL Server performance tuning and monitoring requires a multi-layered approach. The proper configuration of the resources (hardware) is the primary area of focus. This ensures that SQL Server will retain adequate resources that are tuned for performance and fault tolerance as a foundation for an optimized data platform.
The important ingredient in performance tuning is planning an appropriate baseline and benchmarking the data platform. Such planning requires an understanding of storage architecture and indexing of data tables. The process of baseline and benchmarking will enable better monitoring aspects.
In this recipe, we will cover the best usage of the Dynamic Management Views (DMV), which is important when fine tuning the database performance and implementing monitoring methods.
Getting ready
Whenever you are seeking help to fine tune the performance, the response will always be 'it depends', as it is purely dependent upon the individual environment and configuration settings on hardware and software. To keep up the performance, the statistics on the table must be updated regularly as this will decide how best to execute the query. SQL Server may choose a less-than-optimal plan, if it is basing its execution decisions on stale statistics. In order to fine tune the performance it is important to capture and evaluate the currently executed statements on the SQL Server. The internal query architecture will save a plan for every statement that is executed on SQL Server.
To monitor a query process, the Profiler tool is used. It is a resource-intensive application that might cause additional problems, if the current environment is already hampered with the slow performance of queries. Hence, it's best to use TSQL based on capture using Dynamic Management View (DMVs), which returns the snapshot of the current system state without causing any overhead to the SQL Server.
How to do it...
To get started, you need to complete the following steps:
- Connect to the SQL Server instance and open the query editor by clicking on the New Query button on SSMS.
- To obtain a snapshot of the current running queries run the following TSQL:
SELECT r.session_id, r.status, r.start_time, r.command, s.textFROMsys.dm_exec_requests r
CROSSAPPLYsys.dm_exec_sql_text(r.sql_handle) s
WHERE r.status='running'
- In addition to that process, let us obtain an extended version of queries that are executed in batches along with statistical information by executing the following TSQL statement:
SELECT s2.dbid,s1.sql_handle,(SELECTTOP 1SUBSTRING(s2.text,statement_start_offset / 2+1 ,((CASEWHEN statement_end_offset =-1 THEN (LEN(CONVERT(nvarchar(max),s2.text))* 2)ELSE statement_end_offset END)- statement_start_offset)/ 2+1))AS sql_statement, execution_count, plan_generation_num, last_execution_time, total_worker_time, last_worker_time, min_worker_time, max_worker_time,total_physical_reads, last_physical_reads, min_physical_reads, max_physical_reads, total_logical_writes, last_logical_writes, min_logical_writes, max_logical_writes
FROMsys.dm_exec_query_statsAS s1
CROSSAPPLYsys.dm_exec_sql_text(sql_handle)AS s2
WHERE s2.objectid isnull
ORDERBY s1.sql_handle, s1.statement_start_offset, s1.statement_end_offset;
Note
The results of the previous query will help you to understand the execution context such as physical reads, logical writes, and worker threads.
To display the execution plan (detailed) for an SQL statement or batches, use the following statements at the top of the query:
SET SHOWPLAN_ALL, SET SHOWPLAN_TEXT,and SET SHOWPLAN_XML.Here is the code example to show the way SQL optimizer analyzes and optimizes the use of indexes in queries:
USE AdventureWorks2008R2;
GO
SETSHOWPLAN_ALLON;
GO
SELECT Person.Contact.ContactID, Person.Contact.FirstName, Person.Contact.LastName,
Person.Contact.EmailAddress, HumanResources.Employee.Gender, HumanResources.Employee.BirthDate
FROM HumanResources.EmployeeINNERJOIN Person.Contact
ON HumanResources.Employee.ContactID= Person.Contact.ContactID
GO
SETSHOWPLAN_ALLOFF;
GO
- SQL Server 2008 R2 tools and system internal commands will be useful to identify and narrow down the problem. The first source of information you need to obtain is the resource usage such as executing threads and waits.
- Using the
sys.dm_os_wait_statsDMV, we can obtain the wait stats encountered by threads that are executed. The aggregate result of this DMV will help to diagnose the performance of specific queries and batches execution:SELECT TOP 10 wait_type, wait_time_ms FROM sys.dm_os_wait_stats WHERE wait_type NOTIN ('LAZYWRITER_SLEEP','SQLTRACE_BUFFER_FLUSH', 'REQUEST_FOR_DEADLOCK_SEARCH','LOGMGR_QUEUE', 'CHECKPOINT_QUEUE','CLR_AUTO_EVENT','WAITFOR', 'BROKER_TASK_STOP','SLEEP_TASK','BROKER_TO_FLUSH') ORDER BY wait_time_ms DESC
Note
In order to view the Server-scoped dynamic management views and functions, the relevant login requires
VIEW SERVER STATEpermission on the server. Similarly, for database-scoped dynamic management views and functions, the login requiresVIEW DATABASE STATEpermission on the database
How it works...
The sys.dm_exec_requests DMV returns information about each request that is executing within SQL Server instance. The sys.dm_exec_requests DMV execution is a two-fold process, which joins within another system catalog to obtain the information on a command execution. The column names that are used in DMV are self-explanatory. Select the session ID, status of the query, start time, command type, (such as SELECT/INSERT/UPDATE/ DELETE/DBCC/BACKUP DB) and actual text that is used in the execution.
The sys.dm_exec_sql_text function returns the text of the SQL batch that is identified with the sql_handle column. As you can see in the previous query, the function takes the sql_handle value from the sys.dm_exec_requests DMV with a CROSS APPLY join type to return associated SQL text. The final layer is the WHERE clause, which gives you the values for the status of the request which can be: Background/Running/Runnable/Sleeping/Suspended, and cannot be null to complete the execution. To obtain a current snapshot of the query execution, the following two DMVs sys.dm_exec_sql_text and sys.dm_exec_requests are used.
Understanding a query execution plan is essential to fix a poorly performing query to obtain a detailed execution plan in the form of graphical/text/XML format. The following information is visible from the query execution plan:
- Highest cost queries within a batch and highest cost operators within a query
- Index or table scans (accessing all the pages in a heap or index) against using seeks
- Missing statistics or other warnings
- Costly sort or calculation activities
- High row counts being passed from operator to operator
- Discrepancies between the estimated and actual row counts
- Implicit data type conversions
The output is provided with the plan information, without executing the query which allows you to adjust the query or indexes on the referenced tables before actually executing it. Each of these commands return the information in a different way. Further, within the query editor at the beginning of the query, using SET SHOWPLAN_ALL returns the estimated query plan in a tabular format, with multiple columns and rows. The SET SHOWPLAN_TEXT command returns the data in a single column, with multiple rows for each operation. You can also return a query execution plan in XML format using the SET SHOWPLAN_XML command. The syntax for each of these commands is very similar. Each command is enabled when set to ON, and disabled when set to OFF:
SET SHOWPLAN_ALL { ON | OFF}
SET SHOWPLAN_TEXT { ON | OFF}
SET SHOWPLAN_XML { ON | OFF}
The output includes information such as the estimated IO or CPU of each operation, estimated rows involved in the operation, operation cost (relative to itself and variations of the query), and the physical and logical operators used.
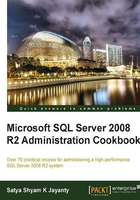
The output from the first query of SETSHOWPLAN_ALL will provide information about PhysicalOperation, LogicalOperation, EstimateIO, EstimateCPU, and AvgRowSize, as shown in the following screenshot:

In addition to using the SETSHOWPLAN_ALL TSQL statement, you can use the SET STATISTICS PROFILE statement to obtain the executed query result set, followed by an additional result set that shows a profile of query executions. The additional information is as follows:

The results are shown in the following screenshot:

It should be observed that, there are additional commands that can be used to return the query and batch execution statistics information using SET STATISTICS IO, SET STATISTICS TIME, SET STATISTICS PROFILE, and SET STATISTICS XML statements. These are different to SHOWPLAN commands, which return the actual execution of statements and the SET STATISTICS IO command, which returns disk activity generated during the query execution. The SET STATISTICS TIME command returns the number of milliseconds taken to parse, compile, and execute each statement executed in the batch.
The resource usage information on 'threads' and 'waits' is obtained using sys.dm_os_wait_stats DMV. The results will be as shown in the following screenshot:

Tip
Similar information can be obtained using SSMS dashboard reports on server-scope and database-scope. For instance, on server-scope, we can refer to Performance | Batch Execution Statistics or Performance | Top queries by Average CPU. On database-scope, refer to Resource Locking Statistics by Objects and Object Execution Statistics.
As a part of baseline and benchmarking strategy, the historic information for query statistics and resource usage can be obtained using Management Data Warehouse (MDW) | Data collector:Server Activity and Query Statistics report.
From the results, the two wait types are presented, FT_IFTS_SCHEDULER_IDLE_WAIT which is used as a background task process by full-text search requests which indicates it is waiting for work to do.
At this point in time, we can safely ignore the outcome unless there are complaints from the users about application search functionality, which uses Full-text search service. Further information on detailed information and interpretation of these wait types can be obtained from SQL Server Books Online that are published by Microsoft. The results from sys.dm_os_wait_stats DMV produces another wait type SQLTRACE_INCREMENTAL_FLUSH_SLEEP value, which indicates the internal trace, SQL trace or PROFILER process with a high value in number, which can be related to corresponding I/O problems on the server.
Tip
In order to get accurate information on the statistics of wait types based on the defined period of time, you can execute the DBCC SQLPERF ('sys.dm_os_wait_stats', CLEAR) statement on that SQL Server instance. This DBCC statement will reset the wait-statistics that will cause a significant change of information, which can be executed by SysAdmin privilege logins only on the Production instance.